The project, carried out for the City of Helsinki’s Urban Environment Division, aimed to create a modern visualization concept for energy and environmental data. The goal was to provide building users with clear information about energy consumption and practical ways to influence it and save energy.
The assignment was part of the EU-funded mySMARTLife project, which develops new, comprehensive solutions for energy consumption and mobility in cities. Although the procurement focused on data visualization for Viikki Environment House, the result was a scalable concept that can also be used in other City of Helsinki properties.
The visualization was designed both to communicate energy efficiency and to encourage people working in and visiting the building to save energy through their own actions.
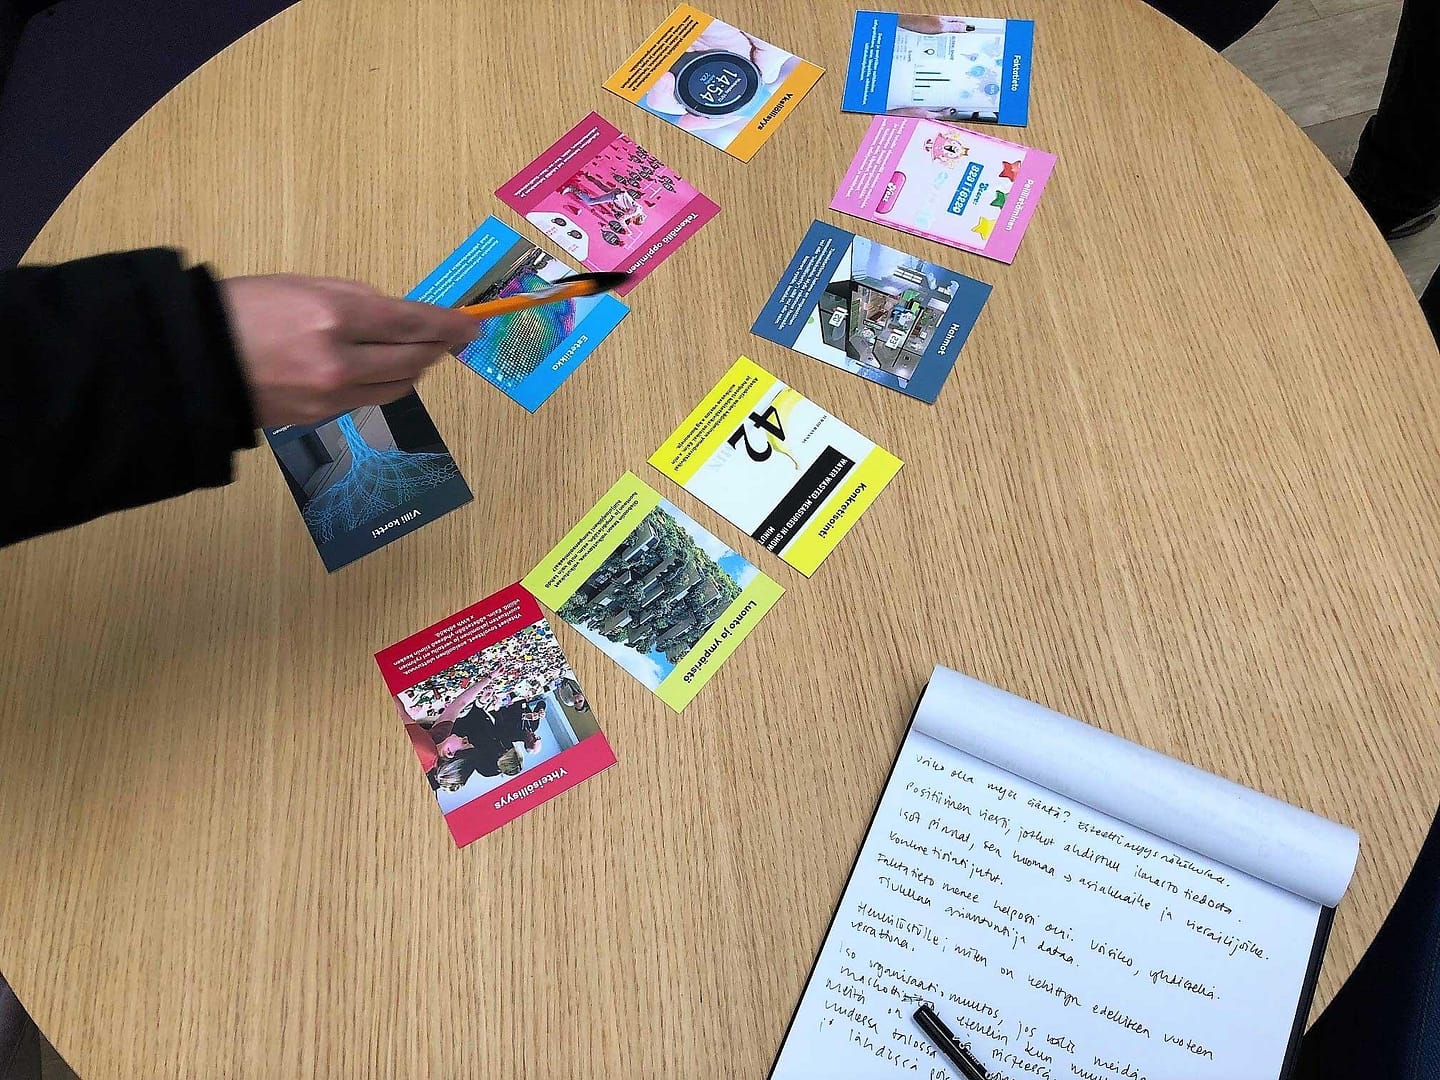
Together with users, the project team ideated and tested meaningful ways to present information and create engaging content through bodystorming and prototyping.
The result was a comprehensive energy data visualization concept covering different touchpoints and including sample content. The deliverables included user profiles and usage environments, a scalable visualization concept, and sample content and interface views.
Energy and Environmental Data
The relevance of the content was validated with users through prototype testing and an evaluation session. The aim was to select the most suitable topics for each property from a range of content options. The lobby display and touchscreen examples are presented in greater detail in the interactive prototypes.
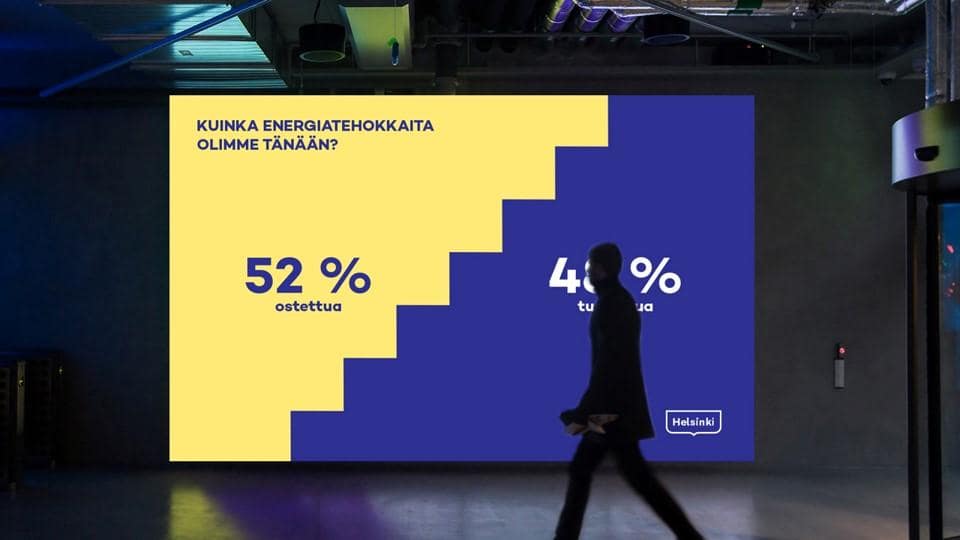
Lobby Display
The Display Presents the Following Information About the Property: Energy-Saving Target and Comparison with the Previous Year
Self-Sufficiency Rate and Energy Production
Monthly Energy Consumption Target and Progress Tracking
Total Energy Consumption and Breakdown
Energy Consumption Trend
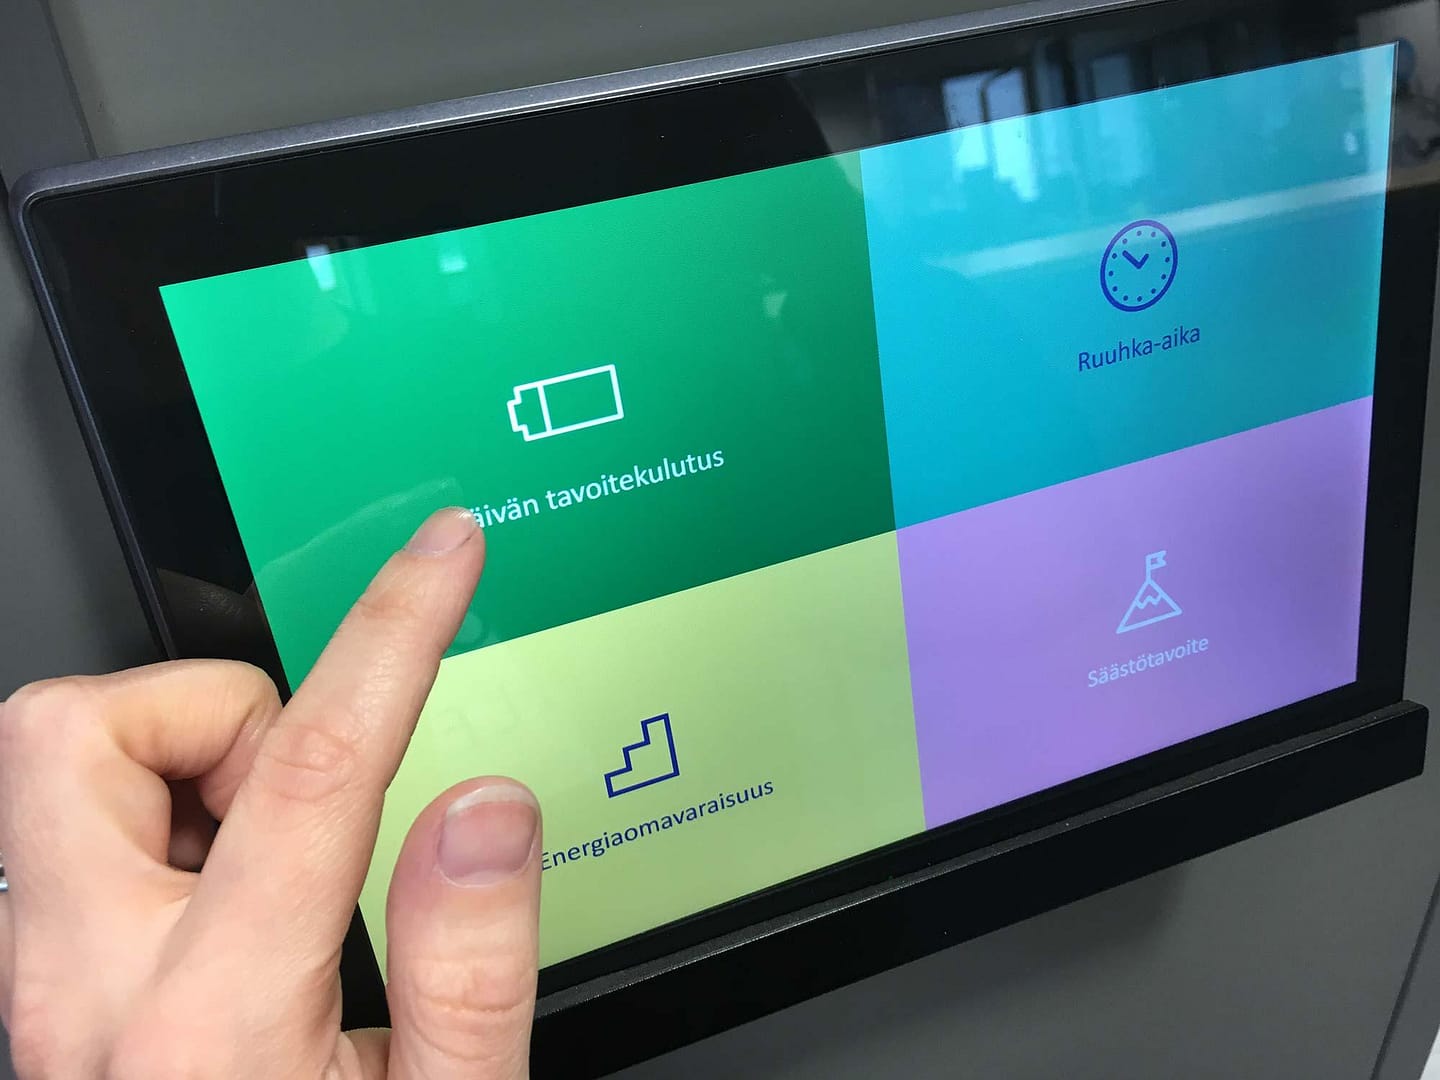
Touchscreen
The Content Can Be Divided into the Following Sections:
Property-Specific Energy Data (the Same Content as on the Lobby Display, with Additional Views Providing More Detailed Information)
General Information and Energy-Saving Tips (e.g., Demand Response and Peak Energy Consumption Times)
City-Level Strategic Goals (e.g., Carbon-Neutral Helsinki 2035)
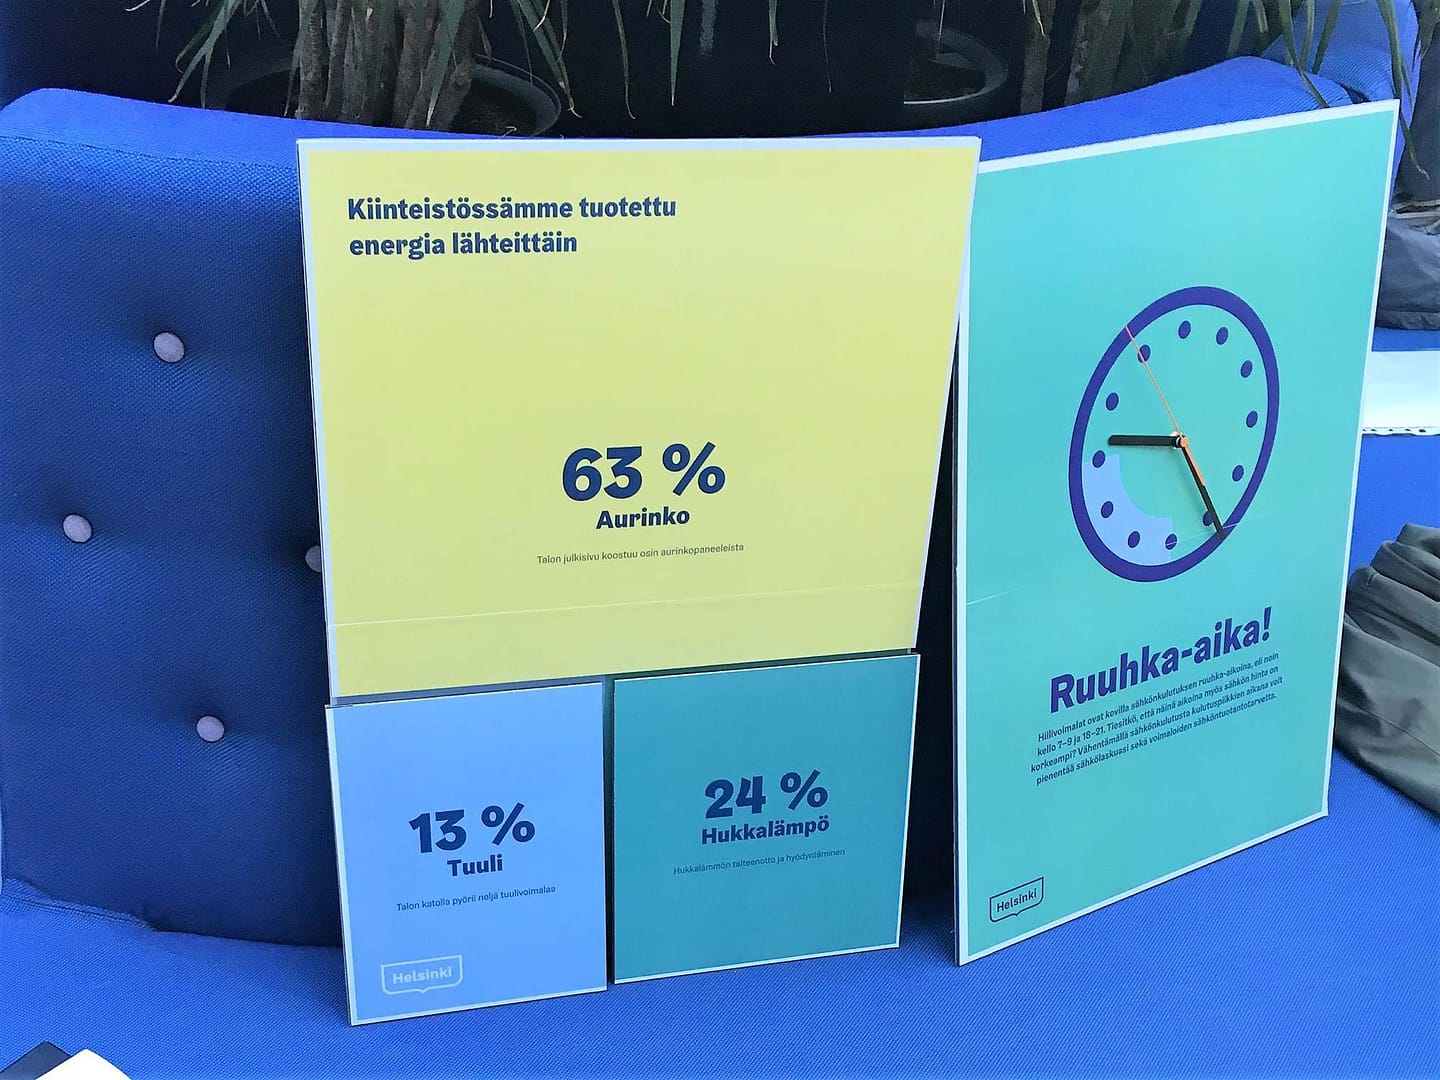
Physical Boards
An Annual Overview of Total Energy Consumption:
By Property and/or
At City Level
Additional Information and Explanations, Such As:
Energy consumption trends and contributing factors, > e.g., what has affected energy consumption: an exceptionally cold winter, changes in building occupancy, etc.
Energy savings in euros, > e.g., “We saved €X by producing our own energy with solar power.”